Forretning på Fortuna
Industries
Forretningsfordeling efter branche Lokale Tjenester: 16,7 %
Restauranter: 13,3 %
Professionelle tjenester: 13,3 %
Religion: 10 %
Fællesskab & ledelse: 10 %
Mad: 6,7 %
Industri: 6,7 %
Bilindustri: 6,7 %
Indkøb: 3,3 %
Husholdnings Tjenster.: 3,3 %
Hoteller & Rejse: 3,3 %
Finansielle Ydelser: 3,3 %
Sport & Aktiviteter: 3,3 %
| Området for Fortuna, North Dakota | 1,012 mi² |
| Befolkning | 20 |
| Befolkningsændring fra 1975 til 2015 | +81,8 % |
| Befolkningsændring fra 2000 til 2015 | -16,7 % |
| Områdenumre | 701 |
| Lokal tid | onsdag 22.17 |
| Tidszone | Central-sommertid |
| Lat & Lng | 48.91003° / -103.77937° |
| Postnumre | 58844 |
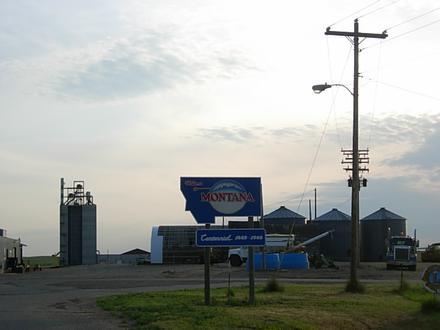
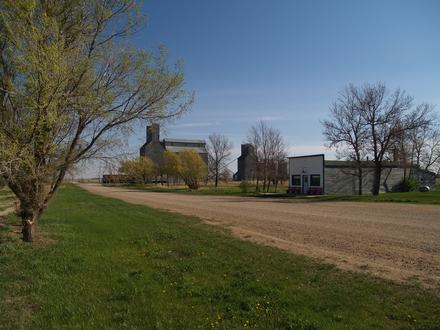
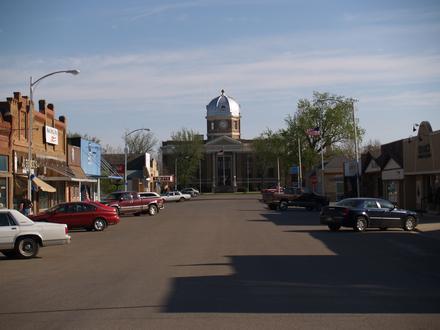
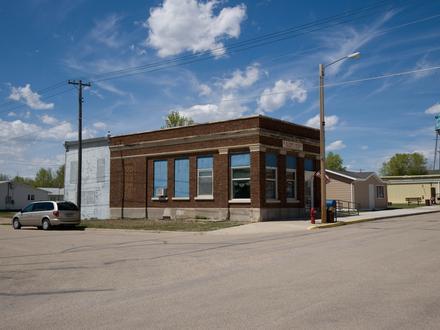
Fortuna, North Dakota - Kort
Fortuna, North Dakota Befolkningsantal
År 1975 til 2015| Data | 1975 | 1990 | 2000 | 2015 |
|---|---|---|---|---|
| Befolkning | 11 | 17 | 24 | 20 |
| Befolkningstæthed | 10,9 / mi² | 16,8 / mi² | 23,7 / mi² | 19,8 / mi² |
Fortuna Ændring i befolkningsantal fra 2000 til 2015
Mindskning i 16,7 % fra år 2000 til 2015| Beliggenhed | Ændring siden 1975 | Ændring siden 1990 | Ændring siden 2000 |
|---|---|---|---|
| Fortuna, North Dakota | +81,8 % | +17,6 % | -16,7 % |
| North Dakota | +20,9 % | +13,1 % | +6 % |
| USA | +46,9 % | +27,2 % | +13,7 % |
Fortuna, North Dakota befolkningstæthed
Befolkningstæthed: 19,8 / mi²| Beliggenhed | Befolkning | Areal | Befolkningstæthed |
|---|---|---|---|
| Fortuna, North Dakota | 20 | 1,012 mi² | 19,8 / mi² |
| North Dakota | 681.824 | 70.698,7 mi² | 9,64 / mi² |
| USA | 321,6 millioner | 3.796.761,2 mi² | 84,7 / mi² |
Fortuna, North Dakota Prognose for befolkningsantal
Estimeret befolkningsantal fra 1975 til 2100Sources:
1. JRC (European Commission's Joint Research Centre) work on the GHS built-up grid
2. CIESIN (Center for International Earth Science Information Network)
3. [Link] Klein Goldewijk, K., Beusen, A., Doelman, J., and Stehfest, E.: Anthropogenic land use estimates for the Holocene – HYDE 3.2, Earth Syst. Sci. Data, 9, 927–953, https://doi.org/10.5194/essd-9-927-2017, 2017.
Human Development Index (HDI)
Statistisk sammensat indeks over forventet levealder, uddannelse og indkomst pr. Indbygger.Sources: [Link] Kummu, M., Taka, M. & Guillaume, J. Gridded global datasets for Gross Domestic Product and Human Development Index over 1990–2015. Sci Data 5, 180004 (2018) doi:10.1038/sdata.2018.4
Fortuna, North Dakota CO2-udledninger
Kuldioxid (CO2) -emissioner pr. Indbygger i ton pr. År| Beliggenhed | CO2-udledning | CO2-emissioner pr. Indbygger | CO2-emissioner Intensitet |
|---|---|---|---|
| Fortuna, North Dakota | 314,4 tn | 15,7 tn | 310,8 tn/mi² |
| North Dakota | 13.690.735 tn | 20,1 tn | 193,6 tn/mi² |
| USA | 5.664.619.809 tn | 17,6 tn | 1.491 tn/mi² |
Fortuna, North Dakota CO2-udledninger
| 2013 CO2-udledninger (ton/år) | 314,4 tn |
| 2013 CO2-udledninger (ton/år) per indbygger | 15,7 tn |
| 2013 CO2-udledningsintensitet (ton/mi²/år) |
Naturlige farer
Relativ risiko ud af 10| Tørke | Medium (5) |
* Risiko, især for oversvømmelse eller skred, er muligvis ikke for hele området.
Sources: 1. Dilley, M., R.S. Chen, U. Deichmann, A.L. Lerner-Lam, M. Arnold, J. Agwe, P. Buys, O. Kjekstad, B. Lyon, and G. Yetman. 2005. Natural Disaster Hotspots: A Global Risk Analysis. Washington, D.C.: World Bank. https://doi.org/10.1596/0-8213-5930-4.
2. Center for Hazards and Risk Research - CHRR - Columbia University, Center for International Earth Science Information Network - CIESIN - Columbia University, and International Research Institute for Climate and Society - IRI - Columbia University. 2005. Global Drought Hazard Frequency and Distribution. Palisades, NY: NASA Socioeconomic Data and Applications Center (SEDAC). https://doi.org/10.7927/H4VX0DFT.
Nylige jordskælv i nærheden
Størrelse 3.0 og større| Dato | Tid | Magnitude | Afstand | Dybde | Beliggenhed | Link |
|---|---|---|---|---|---|---|
| 11.11.1998 | 03.59 | 3,5 | 44,3 km | 5.000 m | eastern Montana | usgs.gov |
| 28.07.1998 | 20.31 | 3,8 | 90,9 km | 5.000 m | eastern Montana | usgs.gov |
| 09.03.1982 | 05.10 | 3,3 | 47,8 km | 18.000 m | eastern Montana | usgs.gov |
| 05.09.1975 | 13.47 | 3,85 | 75,2 km | 5.000 m | eastern Montana | usgs.gov |
| 15.05.1909 | 20.15 | 5,5 | 19 km | None | Saskatchewan, Canada | usgs.gov |
Om vores data
Dataene på denne side estimeres ved hjælp af et antal offentligt tilgængelige værktøjer og ressourcer. Det leveres uden garanti og kan indeholde unøjagtigheder. Brug på din egen risiko. Se her for mere information.