- Verden
- »
- US
- »
- Texas
- »
- Cinco Ranch, Texas
Forretning på Cinco Ranch
| Området for Cinco Ranch, Texas | 4,942 mi² |
| Befolkning | 22.455 |
| Mandlig befolkning | 11.032 (49,1 %) |
| Kvindelig befolkning | 11.423 (50,9 %) |
| Befolkningsændring fra 1975 til 2015 | +47,5 % |
| Befolkningsændring fra 2000 til 2015 | +92,8 % |
| Middelalder | 38,3 |
| Mandlig middelalder | 38,2 |
| Kvindelig middelalder | 38,4 |
| Lokal tid | fredag 10.30 |
| Tidszone | Central-sommertid |
| Lat & Lng | 29.73884° / -95.758° |
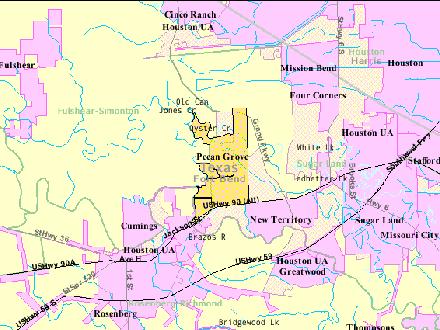
Cinco Ranch, Texas - Kort
Cinco Ranch, Texas Befolkningsantal
År 1975 til 2015| Data | 1975 | 1990 | 2000 | 2015 |
|---|---|---|---|---|
| Befolkning | 15.220 | 11.392 | 11.646 | 22.455 |
| Befolkningstæthed | 3.079 / mi² | 2.305 / mi² | 2.356 / mi² | 4.543 / mi² |
Cinco Ranch Ændring i befolkningsantal fra 2000 til 2015
Forøgelse i 92,8 % fra år 2000 til 2015| Beliggenhed | Ændring siden 1975 | Ændring siden 1990 | Ændring siden 2000 |
|---|---|---|---|
| Cinco Ranch, Texas | +47,5 % | +97,1 % | +92,8 % |
| Texas | +111 % | +60,8 % | +31,3 % |
| USA | +46,9 % | +27,2 % | +13,7 % |
Cinco Ranch, Texas gennemsnitsalder
Gennemsnitsalder: 38,3 år| Beliggenhed | Middelalder | Median alder (kvinde) | Median alder (mand) |
|---|---|---|---|
| Cinco Ranch, Texas | 38,3 år | 38,4 år | 38,2 år |
| Texas | 33,8 år | 34,8 år | 32,8 år |
| USA | 37,4 år | 38,7 år | 36,1 år |
Cinco Ranch, Texas Befolkningstræ
Befolkning efter alder og køn| Alder | Mandlig | Kvindelig | Total |
|---|---|---|---|
| Under 5 | 611 | 617 | 1.229 |
| 5-9 | 971 | 914 | 1.886 |
| 10-14 | 1.212 | 1.143 | 2.355 |
| 15-19 | 1.091 | 1.009 | 2.101 |
| 20-24 | 419 | 451 | 871 |
| 25-29 | 395 | 456 | 851 |
| 30-34 | 366 | 521 | 887 |
| 35-39 | 694 | 880 | 1.575 |
| 40-44 | 939 | 1.148 | 2.088 |
| 45-49 | 1.077 | 1.218 | 2.296 |
| 50-54 | 1.301 | 1.201 | 2.502 |
| 55-59 | 861 | 737 | 1.599 |
| 60-64 | 487 | 442 | 929 |
| 65-69 | 292 | 277 | 569 |
| 70-74 | 127 | 163 | 290 |
| 75-79 | 100 | 105 | 206 |
| 80-84 | 51 | 76 | 128 |
| 85 Plus | 38 | 66 | 104 |
Cinco Ranch, Texas befolkningstæthed
Befolkningstæthed: 4.543 / mi²| Beliggenhed | Befolkning | Areal | Befolkningstæthed |
|---|---|---|---|
| Cinco Ranch, Texas | 22.455 | 4,942 mi² | 4.543 / mi² |
| Texas | 27,5 millioner | 268.597,7 mi² | 102,5 / mi² |
| USA | 321,6 millioner | 3.796.761,2 mi² | 84,7 / mi² |
Cinco Ranch, Texas Prognose for befolkningsantal
Estimeret befolkningsantal fra 1975 til 2100Sources:
1. JRC (European Commission's Joint Research Centre) work on the GHS built-up grid
2. CIESIN (Center for International Earth Science Information Network)
3. [Link] Klein Goldewijk, K., Beusen, A., Doelman, J., and Stehfest, E.: Anthropogenic land use estimates for the Holocene – HYDE 3.2, Earth Syst. Sci. Data, 9, 927–953, https://doi.org/10.5194/essd-9-927-2017, 2017.
Human Development Index (HDI)
Statistisk sammensat indeks over forventet levealder, uddannelse og indkomst pr. Indbygger.Sources: [Link] Kummu, M., Taka, M. & Guillaume, J. Gridded global datasets for Gross Domestic Product and Human Development Index over 1990–2015. Sci Data 5, 180004 (2018) doi:10.1038/sdata.2018.4
Cinco Ranch, Texas CO2-udledninger
Kuldioxid (CO2) -emissioner pr. Indbygger i ton pr. År| Beliggenhed | CO2-udledning | CO2-emissioner pr. Indbygger | CO2-emissioner Intensitet |
|---|---|---|---|
| Cinco Ranch, Texas | 449.539 tn | 20 tn | 90.960 tn/mi² |
| Texas | 488.896.034 tn | 17,8 tn | 1.820 tn/mi² |
| USA | 5.664.619.809 tn | 17,6 tn | 1.491 tn/mi² |
Cinco Ranch, Texas CO2-udledninger
| 2013 CO2-udledninger (ton/år) | 449.539 tn |
| 2013 CO2-udledninger (ton/år) per indbygger | 20 tn |
| 2013 CO2-udledningsintensitet (ton/mi²/år) |
Naturlige farer
Relativ risiko ud af 10| Cyclone | Høj (7) |
| Tørke | Lav (2) |
| Flood | Høj (9) |
* Risiko, især for oversvømmelse eller skred, er muligvis ikke for hele området.
Sources: 1. Dilley, M., R.S. Chen, U. Deichmann, A.L. Lerner-Lam, M. Arnold, J. Agwe, P. Buys, O. Kjekstad, B. Lyon, and G. Yetman. 2005. Natural Disaster Hotspots: A Global Risk Analysis. Washington, D.C.: World Bank. https://doi.org/10.1596/0-8213-5930-4.
2. Center for Hazards and Risk Research - CHRR - Columbia University, Center for International Earth Science Information Network - CIESIN - Columbia University. 2005. Global Flood Hazard Frequency and Distribution. Palisades, NY: NASA Socioeconomic Data and Applications Center (SEDAC). https://doi.org/10.7927/H4668B3D.
3. Center for Hazards and Risk Research - CHRR - Columbia University, Center for International Earth Science Information Network - CIESIN - Columbia University, International Bank for Reconstruction and Development - The World Bank, and United Nations Environment Programme Global Resource Information Database Geneva - UNEP/GRID-Geneva. 2005. Global Cyclone Hazard Frequency and Distribution. Palisades, NY: NASA Socioeconomic Data and Applications Center (SEDAC). https://doi.org/10.7927/H4CZ353K.
4. Center for Hazards and Risk Research - CHRR - Columbia University, Center for International Earth Science Information Network - CIESIN - Columbia University, and International Research Institute for Climate and Society - IRI - Columbia University. 2005. Global Drought Hazard Frequency and Distribution. Palisades, NY: NASA Socioeconomic Data and Applications Center (SEDAC). https://doi.org/10.7927/H4VX0DFT.

Om vores data
Dataene på denne side estimeres ved hjælp af et antal offentligt tilgængelige værktøjer og ressourcer. Det leveres uden garanti og kan indeholde unøjagtigheder. Brug på din egen risiko. Se her for mere information.